
Instructor Insights pages are part of the OCW Educator initiative, which seeks to enhance the value of OCW for educators.
Course Overview
This page focuses on the course 15.097 Prediction: Machine Learning and Statistics as it was taught by Professor Cynthia Rudin in Spring 2012.
This introductory course provides a selection of the most important topics from the subjects of machine learning and statistical methods.
Course Outcomes
Course Goals for Students
- Gain a foundational understanding of how machine learning and statistical algorithms work
- Explore statistical learning theory, which provides the mathematical foundation for machine learning algorithms
- Learn about Bayesian analysis
- Leave the course with a toolbox of algorithms that can be used on students’ own datasets
Possibilities for Further Study/Careers
15.097 prepares students for more in-depth study in fields involving predictive modeling.
Curriculum Information
Prerequisites
- Permission of instructor.
- Knowledge of MATLAB® may be helpful.
Offered
This course was offered once in Spring 2012.
Instructor Insights
In the following paper, Professor Cynthia Rudin describes various aspects of how she taught 15.097 Prediction: Machine Learning and Statistics. Topics include the organizational structure of the course and the strategy of using of large-font lecture notes.
Teaching "Prediction: Machine learning and Statistics” (PDF)
The Classroom
 Room 1 of 1
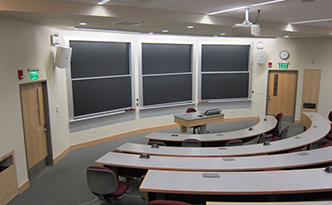
Lecture
Lectures were held in a classroom with tiered seating, AV equipment, and sliding chalkboards.
Assessment
The students' grades were based on the following activities:
 50% Problem sets
 10% Course project proposal
 2% Course project advertisement
 38% Course project paper and talk
Student Information

Breakdown by Year
Mostly graduate students
Breakdown by Major
Predominantly students from the Operations Research Center
Typical Student Background
Students had a general background in mathematics. Topics from machine learning and statistical methods were new to them.
During an average week, students were expected to spend 12 hours on the course, roughly divided as follows:
Lecture
- Met 2 times per week for 1.5 hours per session; 25 sessions total.
- Lectures based on notes (distributed in class and through the course webpage), with some additional materials, such as source papers or excerpts from textbooks
- Student project talks scheduled during the last two weeks of the class
Out of Class
- Problem sets
- Course projects
Semester Breakdown
| WEEK | M | T | W | Th | F |
|---|---|---|---|---|---|
| 1 |  |  |  | | |
| 2 | | | | | |
| 3 | | | | | |
| 4 | | | | |  |
| 5 | | | | | |
| 6 | | | | | |
| 7 | | | | | |
| 8 | | | | | |
| 9 | | | | | |
| 10 |  | | | | |
| 11 | | | | | |
| 12 | | | | | |
| 13 | |  |  | | |
| 14 |  | |  | | |
| 15 | | | | | |
| 16 | | | | | |
 No classes throughout MIT Lecture sessionStudent project talks
 Project due date
 No class session scheduled
 Student project advertisements presented
 Problem set due date